
Lets go over the numbers given more data:
August 18th
Federal Forest Firefighters are currently fighting a wildfire that ignited near the La Plata Trail in Chaffee County. The “La Plata” fire is estimated to be 15 to 20 acres in size at this time, at high elevation, and growing. The fire has now crossed the county line into Lake County. The fire is all in federal land and no pre- evacuations or evacuations have been called for at this time. There is zero containment at this time.
19th
Location: The wildfire is on the Leadville Ranger District, 4 miles west of Twin Lakes within Chaffee and Lake counties. Start Date: August 17, 2025, at 5:46 p.m. Size: 45 acres Containment: 0% Cause: Human caused Vegetation: Timber-understory, grass and brush Resources: Approximately 32 personnel
20th
Size: 54 acres Containment: 0% Total Personnel: Approximately 90 personnel. More resources are on order and en route. Location: Pike-San Isabel National Forests, 4 miles west of Twin Lakes in Chaffee and Lake counties Reported: August 17, 2025, at 5:46 p.m.
21st
Size: 82 acres Containment: 0% Total Personnel: 129 Location: Pike-San Isabel National Forests, 4 miles west of Twin Lakes in Chaffee and Lake counties Reported: Aug. 17, 2025, at 5:46 p.m.
22nd
Size: 90 acres | Containment: 0% | Total Personnel: 128 Location: Pike-San Isabel National Forests, 4 miles west of Twin Lakes in Chaffee and Lake Counties Reported: Aug. 17, 2025, at 5:46 p.m.
| Date | Size (acres) | Personnel | Containment |
|---|---|---|---|
| Aug 18 | 15–20 → avg 17.5 | ~32 | 0% |
| Aug 19 | 45 | 32 | 0% |
| Aug 20 | 54 | 90 | 0% |
| Aug 21 | 82 | 129 | 0% |
| Aug 22 | 90 | 128 | 0% |
| Metric | Updated Value |
|---|---|
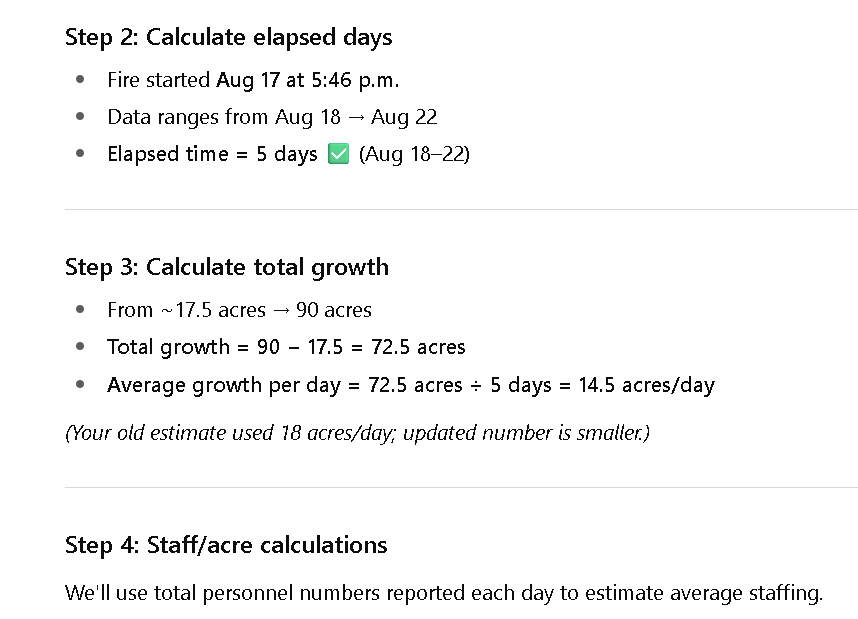
| Elapsed time | 5 days |
| Average acres/day | 14.5 |
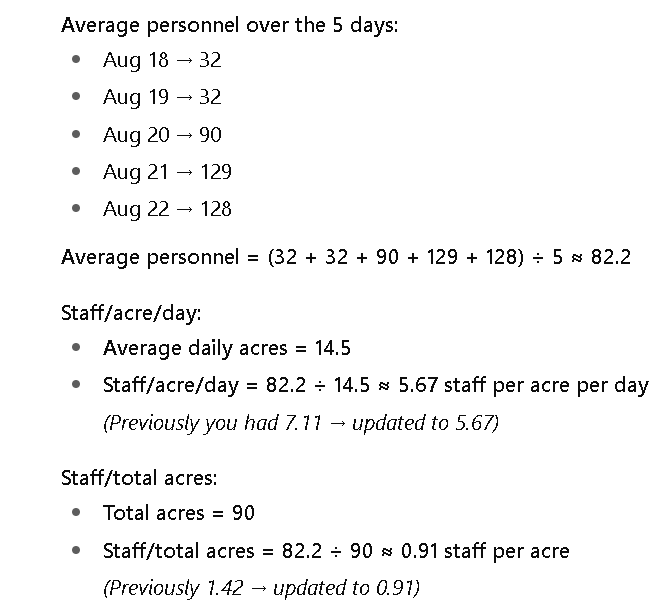
| Staff/acre/day | 5.67 |
| Staff/total acres | 0.91 |
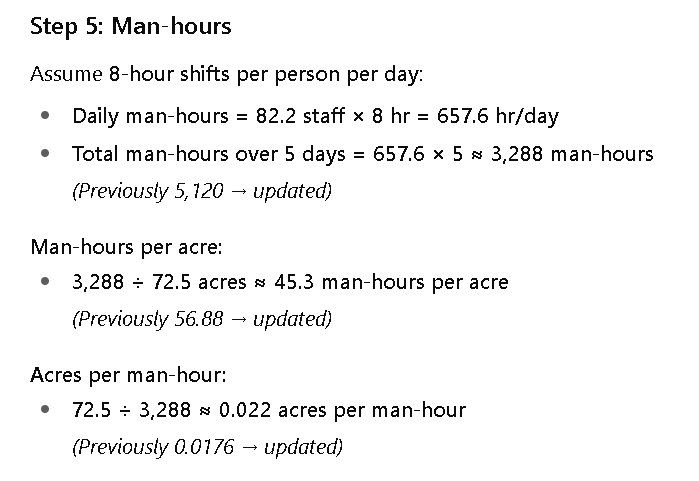
| Non-overtime man-hours (8 hr/day) | 3,288 |
| Man-hours per acre | 45.3 |
| Acres per man-hour | 0.022 |
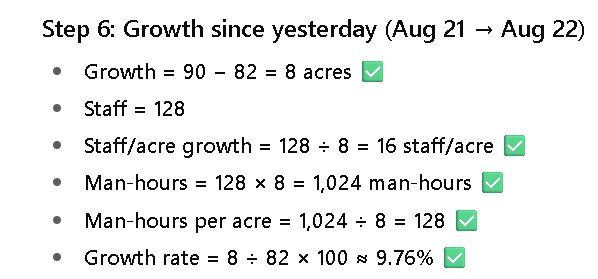
| ONE DAY (Aug 21→22) | |
| Growth | 8 acres |
| Staff/acre growth | 16 |
| Man-hours | 1,024 |
| Man-hours per acre | 128 |
| Growth rate | 9.76% |
| Date | Acres | Personnel | Man-hours (8 hr/day) |
|---|---|---|---|
| Aug 18 | 17.5 | 32 | 256 |
| Aug 19 | 45 | 32 | 256 |
| Aug 20 | 54 | 90 | 720 |
| Aug 21 | 82 | 129 | 1,032 |
| Aug 22 | 90 | 128 | 1,024 |
import matplotlib.pyplot as plt
# Dates
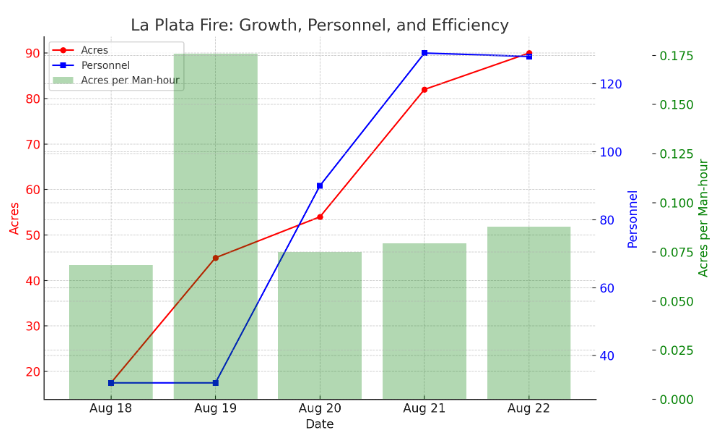
dates = ["Aug 18", "Aug 19", "Aug 20", "Aug 21", "Aug 22"]
# Data
acres = [17.5, 45, 54, 82, 90]
personnel = [32, 32, 90, 129, 128]
man_hours = [p*8 for p in personnel]
acres_per_manhour = [acres[i]/man_hours[i] for i in range(len(acres))]
# Create figure and axes
fig, ax1 = plt.subplots(figsize=(10,6))
# Plot Acres
ax1.plot(dates, acres, color='red', marker='o', label='Acres')
ax1.set_xlabel('Date')
ax1.set_ylabel('Acres', color='red')
ax1.tick_params(axis='y', labelcolor='red')
ax1.set_title('La Plata Fire: Growth, Personnel, and Efficiency')
# Plot Personnel on same graph with secondary y-axis
ax2 = ax1.twinx()
ax2.plot(dates, personnel, color='blue', marker='s', label='Personnel')
ax2.set_ylabel('Personnel', color='blue')
ax2.tick_params(axis='y', labelcolor='blue')
# Plot Acres per Man-hour as bar chart
ax3 = ax1.twinx()
ax3.bar(dates, acres_per_manhour, alpha=0.3, color='green', label='Acres per Man-hour')
ax3.set_ylabel('Acres per Man-hour', color='green')
ax3.tick_params(axis='y', labelcolor='green')
ax3.spines['right'].set_position(('outward', 60)) # Move third axis out
# Add legends
lines, labels = ax1.get_legend_handles_labels()
lines2, labels2 = ax2.get_legend_handles_labels()
lines3, labels3 = ax3.get_legend_handles_labels()
ax1.legend(lines + lines2 + lines3, labels + labels2 + labels3, loc='upper left')
plt.tight_layout()
plt.show()